-
How long does it take to sell property in different areas of France? New study
Many major cities are showing signs of recovery when it comes to supply, demand, prices, and time to sell
-
Tough Airbnb rules in Marseille prompt many property owners to sell
City council reduce time that a property can be rented to short-term guests
-
New notaire data suggests easing of Paris property crisis
Property experts have talked of ‘easing pressure’ and ‘breathing space’ after a four-year slump
MAP: See where apartment prices have risen the most in France
The apartment market in Paris has remained fairly consistent but other areas have boomed, the latest data from notaires shows

The French property market has been booming over the past couple of years, with the non-new-build apartment market benefiting hugely from a rise in sales.
While the price of apartments has not risen quite as rapidly as that of non-new houses, most areas in France saw prices rise in the second quarter of 2022, according to the latest report from Notaires de France.
Read more: MAP: House price rises in France - how has your area fared?
Read more:Seven key points from latest notaire data on French property sales
This report takes into account all property sales and pre-sales that occur in France, with non-new flats generally defined as properties which have previously been owned at least once.
The latest data covers April - June 2022 and compares prices against the averages from January - March 2022 and also April - June 2021.
It was only released recently and is the most comprehensive data available as notaires are involved in all property sales in France.
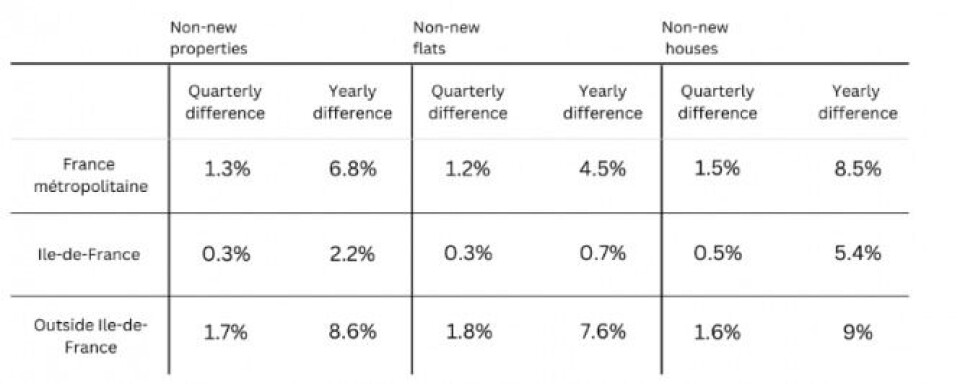
While prices in Ile-de-France have remained fairly consistent throughout the past year, outside of Paris, the non-new apartment market has been thriving, rising by 7.6% compared to April-June last year.
This table shows the percentage rise in the prices of non-new properties as a whole, non-new apartments, and non-new houses in Metropolitan France, Ile-de-France, and everywhere outside of Ile-de-France.
Evolution of property prices in France: Q2, 2022
Quarterly difference is the increase between Q1 2022 and Q2 2022. Yearly difference is the increase between Q2 2021 and Q2 2022.

You can see our maps from January - March 2022 here: MAP: French house price rises continue - how is your area faring?
How have apartment prices changed in France?
The map below shows the evolution of median non-new flat prices between April - June 2021 and April - June 2022.
Prices increased almost everywhere.
For apartments, Paris is unsurprisingly the most expensive by far at €10,590 per m², however this is actually a slight decrease (-0.8%) compared to the same period last year.
In second place is Lyon, at €5,080 per m2, a rise of 0.9% year-on-year.
Meanwhile, prices for apartments are cheapest in Saint Etienne, where the average price per m² is €1,170. However, this is still a rise of 6.2% compared to April-June 2021.
Flats in Bourges saw the greatest percentage rise in France year-on-year, with prices increasing by 14.3% to an average of €1,480.
This map includes a sample of places covering a geographical spread of France, so not all towns or cities are represented.
Related articles
Tax rise for home pools, market slowdown: Five French property updates
Self-heating homes, holiday lets: Five French property updates
Taxe foncière, taxe d’habitation: how are these worked out in France?


